I'm Calling It: AI Will Map Chip Heat in 13 ms as a Standard Design Step by 2028 (I Read the Whole Paper)
By BAEKHO | TREND BYTE
My call: I'm calling it. By the end of 2028, AI heat maps like ThermLeT will be a routine first-pass step when engineers lay out multi-chiplet packages, with a full simulation kept for the final check. The paper that made me say it reports 13 ms against 95 s for the reference simulator (Table V), and I list 3 catches below. (Why, and when I would take it back: Section 7.)
What I did: I read the full paper and explain it here. I did not write it, run the model, repeat any test, or talk to the authors. The call is my opinion, not a claim of the paper or its authors.
Short answer: "ThermLeT" is a transformer model (a type of AI) that predicts the steady-state temperature map of a multi-chiplet package. Its authors report 13 ms per prediction, against 95 s for ANSYS, on a test of 150 layouts built from three chip architectures. The average error against ANSYS is 3.16°C (RMSE). It is a design-stage tool for engineers, not a feature that changes the temperature of the CPU in your PC.
In this post:
- The Paper at a Glance
- Why a Faster Heat Map Matters
- How It Works (a Simplified Picture)
- The Test Setup, Exactly
- The Results, With Sources
- Limitations
- My Take
- FAQ
- Conclusion
This is the first post in a series I call "Paper, Explained Simply." Sections 1 to 6 contain only what the paper states or numbers I calculated from it, and I mark every calculation of mine. My opinions are in the box above and in Section 7.
1. The Paper at a Glance
- Title: ThermLeT: Transformer-based Temperature Prediction for 2.5D Chiplet Architecture
- Authors: Varun Darshana Parekh and Anusha Devulapally (equal contribution), Sivani Devarapalli, Cassius Henderson, Shimeng Yu, Vijaykrishnan Narayanan. Affiliations in the paper: Pennsylvania State University for all except Shimeng Yu, who is at the Georgia Institute of Technology.
- Where: the arXiv entry lists it as published at VLSID 2026, pp. 512-517. The arXiv copy (arXiv:2611.21954 v1 [cs.AR]) was submitted on November 16, 2026; that is the date the preprint was posted, and I did not check the conference dates.
- Funding line in the paper: PRISM, a center of the JUMP 2.0 program of the Semiconductor Research Corporation, sponsored by DARPA
A chiplet is a small chip that is combined with others in one package. A "2.5D" package puts several chiplets side by side on a shared thin base layer called an interposer. The paper's claim, in its own abstract: ThermLeT predicts steady-state temperature "in 13 ms, about four orders of magnitude faster than conventional finite element solvers such as ANSYS."
2. Why a Faster Heat Map Matters
The paper explains that stacked or closely spaced chiplets create local hot spots that hurt reliability and can throttle performance (Section I). Throttling means a chip slows itself down to stay safe.
It also says that automated floor planners sweep thousands of candidate placements per design cycle, and that each new placement needs its temperature checked. The authors put the cost of one traditional check at 95 seconds (Section I and Table V), which they say limits how many layouts designers can sample. A machine-learning predictor, in their words, reduces the time to milliseconds.
My own arithmetic, not in the paper: 1,000 layouts at 95 s each is about 26 hours; at 13 ms each it is about 13 seconds.
3. How It Works (a Simplified Picture)
T
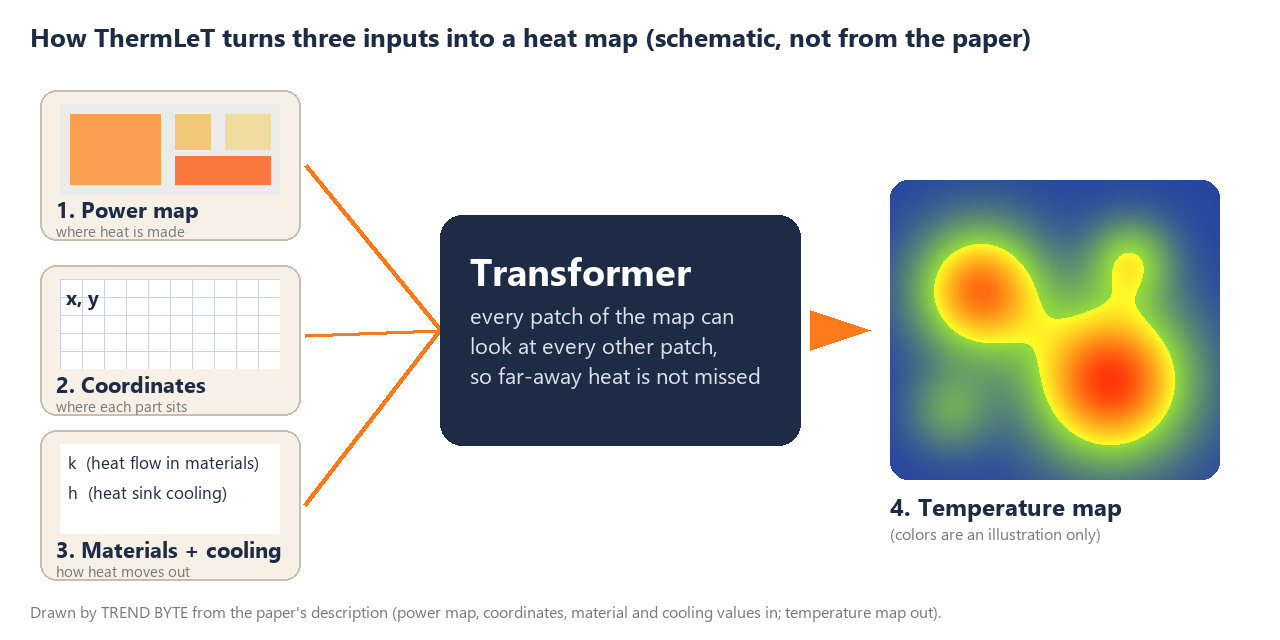
he model takes aligned maps of a package on one grid: a power density map (where heat is produced), coordinate maps (normalized x and y positions), and two scalar values that describe materials and cooling, the thermal conductivity k and the heat-transfer coefficient h (Section III-B). A transformer encoder with six blocks and 12 attention heads processes them, and convolution layers produce a temperature map (Section III-B). The training grid is 224 × 224 (Section III-A).
A simplified analogy (not how the model is built): think of a weather forecaster who looks at one whole map and draws where it will be hot, instead of tracking every raindrop. The paper's point about transformers is that every patch of the map can attend to every other patch, which it says suits heat that spreads over long distances. My drawing is a schematic I made from the paper's description, not a figure from the paper, and its colors are an illustration.
4. The Test Setup, Exactly
These are the conditions behind every number in the next section. Everything below is stated in Sections III and IV.
- Data: 6,221 layouts created by perturbing chiplet center positions and orientations of three architectures: Micro150, Ascend910 and MultiGPU. 150 layouts are held out for testing; the other 6,071 are split 80% training and 20% validation.
- Reference ("ground truth"): steady-state temperature solved in ANSYS Mechanical. Package: silicon interposer (50 mm × 50 mm, and 45 mm × 45 mm for Ascend910), indium thermal interface material, copper heat sink, forced convection of 580, 720 or 950 W/m²K, ambient 23°C.
- Baselines: HotSpot 7.0 (a lumped thermal-resistance model, 32 × 32 grid) and ThermEDGe (a convolutional encoder-decoder; the authors re-implemented it for 224 × 224 inputs and trained it for 50 epochs, power map only).
- Hardware: all experiments on a single NVIDIA A100 GPU (Section IV-A). In the Table V footnote, HotSpot and ANSYS were run on Intel CPUs (the footnote names an i9 for HotSpot and an i7-11700, "4 core," for ANSYS).
- Metrics: RMSE and MAE, both in °C, measured between the prediction and the ANSYS result.
5. The Results, With Sources
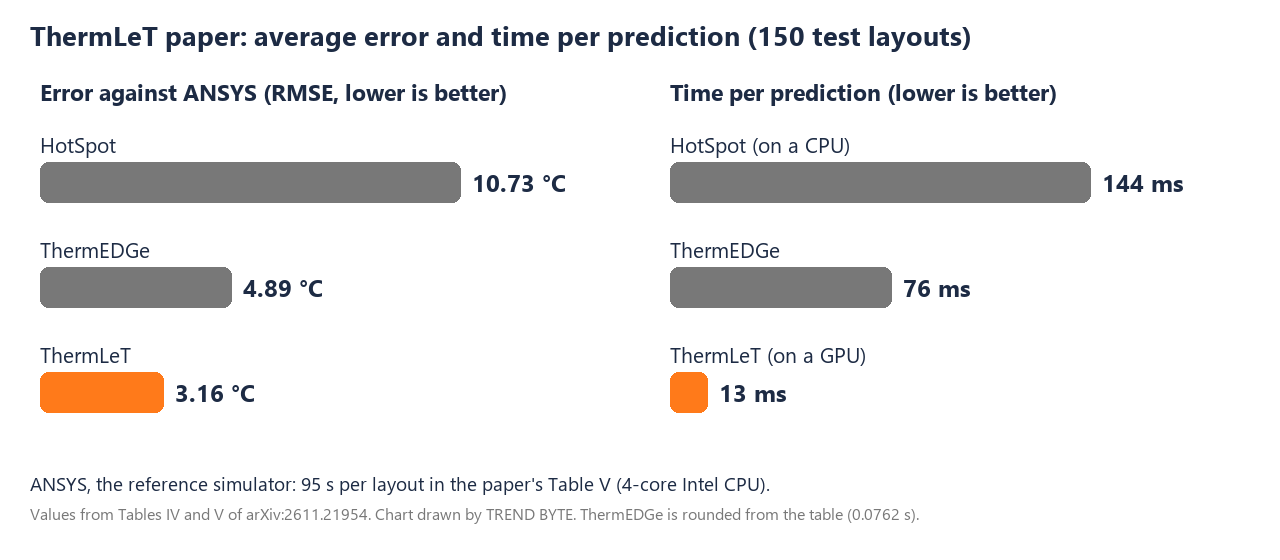
| Method | RMSE (°C) | MAE (°C) | Time per prediction | Source |
|---|---|---|---|---|
| ANSYS (reference) | - | - | 95 s | Table V |
| HotSpot 7.0 | 10.734 | 9.886 | about 144 ms (0.1442 s) | Tables IV, V |
| ThermEDGe | 4.893 | 3.691 | about 76 ms (0.0762 s) | Tables IV, V |
| ThermLeT (full model) | 3.160 | 2.238 | 13 ms (0.0130 s) | Tables IV, V |
- Error reductions (Section IV-C): against ThermEDGe, RMSE 35% and MAE 39% lower; against HotSpot, RMSE 71% and MAE 77% lower. "More accurate" in the abstract means a smaller average error, not "right more often."
- Speed (Section IV-C): about 5.9 times faster than ThermEDGe and about 11.1 times faster than HotSpot. Dividing the Table V numbers for ANSYS and ThermLeT gives about 7,300 (my calculation); the abstract rounds the gap to "about four orders of magnitude."
- Computing cost (Table V): 155.79 GFLOPs per sample for ThermLeT against 11.42 for ThermEDGe (about 13.6 times more). A GFLOP is a billion floating-point operations.
- Which inputs matter (Table VI): power + materials gives RMSE 5.424; power + coordinates gives 6.162; all three give 3.160.
- Unseen architectures (Table VII): trained only on MultiGPU samples, then tested on Ascend910 and Micro150, ThermLeT scores RMSE 8.908 and MAE 7.3745; ThermEDGe scores 9.6493 and 7.6973.
6. Limitations
A. What the paper itself states about its scope (it has no section titled "Limitations," so I am collecting these from the text)
- It predicts steady-state temperature only, not transient behavior (Table I). Steady state is the settled temperature after everything stops changing; transient means how temperature changes over time.
- It predicts temperature; a stress-prediction head and physics-aware attention are listed as future work (Section V).
- The dataset is built from three architectures and ground truth comes from ANSYS simulations (Section III-A).
B. Things visible in the paper's own numbers and footnotes
- The "true" values are simulation results, not measurements of real chips.
- The speed comparison mixes hardware: ThermLeT ran on a GPU, HotSpot and ANSYS on Intel CPUs (Section IV-A, Table V footnote).
- The 150 test layouts come from the same three architectures as the training data (Section IV-A). The unseen-architecture test is Table VII, where error is 8.908°C RMSE.
- A wording slip: the conclusion says "11× in accuracy," but in the results the 11× figure is about speed (against HotSpot, Section IV-C). I used the results tables.
C. For gamers: this is a tool for people who design chip packages. The paper does not test any desktop CPU, cooler or game.
7. My Take
T

his section is my opinion and my own PC, not the paper.
My call, in full. By the end of 2028, AI heat-map predictors like ThermLeT will be a routine first-pass check when engineers lay out multi-chiplet packages, with a full simulation kept for the final sign-off.
Why: in this paper's test, the reference simulator ANSYS needed 95 s per layout and ThermLeT needed 13 ms (Table V), with an average error of 3.16°C RMSE against ANSYS (Table IV). The paper says design tools try thousands of layouts per design cycle (Section I), and a check that is about 7,300 times faster (my division of the two Table V numbers) fits that job.
I take it back if: the error on layouts the model has never seen stays near 9°C (8.908°C in Table VII), or nobody builds on this approach by the end of 2028.
The 3 catches (all from the paper's own numbers and footnotes): the speed comparison is a GPU against CPUs; the "true" temperatures are themselves ANSYS simulations; and on unseen architectures the error is 8.908°C, not 3.16°C. Details are in Section 6.
How the call follows from the numbers. A check that is thousands of times faster than the reference, with an average miss of about 3°C on its test set, looks to me like a good first filter: use the AI to throw away bad layouts quickly, then confirm the final choice with the slow, trusted simulator. That is a bet about workflow, not about your next CPU running cooler.
Where I could be wrong. In my reading, Table VII does not fully back the abstract's "robust generalization": the error rises from 3.160°C to 8.908°C when the layouts differ from the training families, and the edge over ThermEDGe becomes small (8.908 against 9.649). If follow-up work does not bring that number down, I will take the bet back. The speed gain also needs a fair hardware comparison, which this paper does not provide.
My own CPU, for scale only. My PC has a Ryzen 7 9800X3D with a liquid cooler. In my earlier test (a 27-minute log of modded Cyberpunk 2077), the CPU peaked at 64.9°C, and AMD lists 95°C as the maximum. That is a real measurement on my PC. The paper did not predict it. Ryzen chips are also built from chiplets, and the paper names AMD EPYC as an example, but it studies silicon-interposer packages and I did not check what any Ryzen desktop package uses, so do not read this paper as a description of the 9800X3D.
FAQ
Q: What is ThermLeT?
A: A transformer model that predicts the steady-state temperature map of a 2.5D chiplet package, from the paper by Parekh et al. (VLSID 2026). The authors list code and a dataset at github.com/MicroSystemsDesignLab/ThermLeT.
Q: Is it really "10,000 times" faster?
A: The paper says "about four orders of magnitude." Table V gives 95 s for ANSYS and 13 ms for ThermLeT, which is about 7,300 times (my division), and the two ran on different hardware.
Q: Will this make my CPU run cooler?
A: Not by itself. It is a design-stage prediction tool, and the paper tests no desktop CPU or cooler.
Q: Can it predict my PC's temperature in a game?
A: No. It predicts the settled temperature of simulated package layouts, not live temperatures while a game runs.
Conclusion
- Paper: ThermLeT, Parekh et al., VLSID 2026, arXiv:2611.21954 v1.
- Reported: 13 ms per prediction against 95 s for ANSYS, RMSE 3.16°C, on 150 test layouts from three architectures (Tables IV and V).
- Caveats in the paper's own data: simulation as ground truth, GPU versus CPU timing, RMSE 8.908°C on unseen architectures (Table VII).
- My bet, with a deadline: a routine first-pass check in multi-chiplet design by the end of 2028.
Words to Know
- chiplet: a small chip combined with others inside one package. (칩렛)
- interposer: a thin base layer under the chiplets that connects them. (인터포저)
- steady state / transient: the settled temperature versus how temperature changes over time. (정상 상태 / 과도 상태)
- RMSE / MAE: two ways to average how far predictions miss the reference, in °C here; lower is better. (평균 오차)
- finite element solver: slow, detailed physics simulation software such as ANSYS. (유한요소 해석)
- W/m²K: watts per square meter per kelvin, the unit of the heat-transfer coefficient h. (열전달 계수 단위)
- ms: a millisecond, one thousandth of a second. (밀리초)
Source (the paper, in English):
- Parekh, V. D., Devulapally, A., Devarapalli, S., Henderson, C., Yu, S., Narayanan, V. "ThermLeT: Transformer-based Temperature Prediction for 2.5D Chiplet Architecture." arXiv:2611.21954 v1 [cs.AR], November 16, 2026. VLSID 2026, pp. 512-517. arxiv.org/abs/2611.21954 | DOI 10.1109/VLSID68508.2026.00101 | License on arXiv: CC BY 4.0
- Code and dataset listed by the authors: github.com/MicroSystemsDesignLab/ThermLeT
Related posts on TREND BYTE:
Note: This post explains a published paper in simple words, as read on November 21, 2026. I did not run the model or repeat the tests. The schematic and chart are my own drawings from the paper's description and Tables IV and V, not figures from the paper. The temperature capture is from my own PC. I am a Korean speaker and used AI tools to help write the English; every number was checked against the paper (see the Table or Section cited next to it).